The Exchange’s e-cbot® electronic trading platform also set an ADV record during the first quarter with 3,030,856 contracts traded on average each day, a 42 percent increase compared with the first quarter of 2006. For the 2007 first quarter, 78 percent of the Exchange’s total volume was traded on the e-cbot platform.
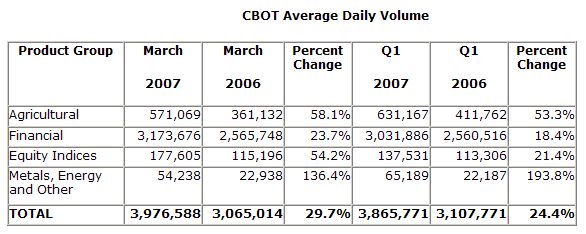
In March 2007, the CBOT achieved double-digit ADV growth for the eleventh consecutive month, when comparing monthly ADV totals with the same month a year earlier. ADV in March 2007 was 3,976,588 contracts and total volume was 87,484,939 contracts, up 30 percent and 24 percent, respectively, over March 2006. Electronic ADV in March 2007 reached 3,258,274 contracts, 52 percent greater than March 2006.
Agricultural Complex
The CBOT Agricultural complex continues to set volume records since the August 2006 introduction of daytime electronic trading of these benchmark futures products. In the first quarter of 2007, the Agricultural complex continued to grow at a faster rate than the overall exchange.
For the first quarter, Agricultural complex ADV reached a quarterly record 631,167 contracts, a 53 percent increase over the first quarter of 2006. For the month of March, ADV was 571,069 contracts, 58 percent greater than the same month in the prior year. Increased electronic trading volume contributed to the record quarterly volume total in the Agricultural complex, with 52 percent of Agricultural futures volume traded on e-cbot.
For the first quarter, electronic ADV in the Agricultural complex was 267,504 contracts and, in March, electronic volume in the Agricultural complex was 5,840,752 contracts, reflecting continued strong growth since the listing of CBOT Agricultural products electronically during daytime trading hours.
The daytime electronic trading of Agricultural products, combined with increased demand for Agricultural risk management tools, generated higher volumes throughout our Agricultural product complex. Corn futures (67 percent), Corn options (153 percent), Wheat futures (19 percent), Wheat options (20 percent), Soybean futures (40 percent), Soybean options (6 percent), Soybean Meal futures (55 percent), Soybean Meal options (12 percent), Soybean Oil futures (52 percent), Soybean Oil options (48 percent), Oat futures (29 percent), Rough Rice futures (20 percent) and Rough Rice options (84 percent) all experienced notable ADV increases compared with totals from the same quarter in 2006.
Financial Complex
CBOT Financial complex ADV was a record 3,031,886 contracts for the first quarter of 2007, an increase of 18 percent over the same period in 2006. For the month of March, total Financial complex ADV was 3,173,676 contracts, up 24 percent compared with March 2006.
During the first quarter, volume in the Financial complex grew significantly at both the short end and long end of the yield curve. At the short end of the curve (30-day Federal Funds futures and options, 2-year U.S. Treasury Note futures and options), total quarterly ADV was 314,669 contracts, up 23 percent compared with the first quarter of 2006. On the long end of the curve (10-year U.S. Treasury Note futures and options, 30-year U.S. Treasury Bond futures and options), total 2007 first quarter ADV was 2,059,430 contracts, an increase of 21 percent over the same quarter in the prior year.
The high mark for Financial complex quarterly ADV was driven, in part, by record ADV in 10-year U.S. Treasury Note futures (1,323,707 contracts) – the most-traded financial contract in the complex. The Exchange also experienced quarterly ADV records in 5-year U.S. Treasury Note futures (609,271 contracts), 2-year U.S. Treasury Note futures (223,880 contracts) and 30-year U.S. Treasury Bond futures (443,667 contracts).
Electronic trading volume of Financial options contracts also continued to grow during the first quarter, as 25 percent of all CBOT options trades were conducted electronically. Financial options electronic ADV reached a record 91,714 contracts in the first quarter – up 70 percent over the same period in 2006. Record quarterly electronic ADV totals for 30-year U.S. Treasury Bond options (17,556 contracts), 10-year U.S. Treasury Note options (61,348 contracts), 5-year U.S. Treasury Note options (10,733 contracts) and 2-year U.S. Treasury Note options (609 contracts) contributed to the overall increase in electronic trading of Financial options.
The Exchange’s newest electronically-traded Financial options contract, its Binary options on the Target Federal Funds Rate, also experienced quarterly ADV growth. An average of 715 contracts traded each day during the first quarter – five times greater than the fourth quarter of 2006, which was the first full quarter the Binaries were available to market participants.
Since the CBOT announced its new market maker program for Interest Rate Swap contracts in July 2006, the Exchange’s Swap complex has continued to experience ADV growth. First quarter ADV in the Swap complex was 4,351 contracts, more than double the first quarter of 2006. 10-year Interest Rate Swap electronic ADV during the first quarter, was 1,707 contracts – more than double the first quarter of 2006. Electronically-traded 5-year Interest Rate Swaps saw ADV increase to 1,155 contracts in the first quarter, nearly three times greater than the same period in 2006. For the month of March, Swap complex ADV was 7,662 contracts, more than double March 2006.
Equity Index Complex
The CBOT set a record in the Equity Index complex during the first quarter, as ADV was 137,531 contracts, up 21 percent compared with the first quarter of 2006. The $5 Mini-Dow Jones® Index futures contributed to the growth across the Equity Index complex, setting an ADV record during the first quarter. An average of 129,328 mini-Dow futures contracts were traded each day for the quarter, up 25 percent over the same period in 2006. During March, ADV in the Equity Index complex was 177,605 contracts, an increase of 54 percent over the ADV total from March 2006. The Exchange launched its new Dow Jones U.S. Real Estate index futures contract earlier in the first quarter, and volume continued to grow during March.
Metals Complex
ADV in the CBOT Metals complex reached a record 65,006 contracts in the first quarter, more than double the ADV from the first quarter of 2006. Full-sized (100 Oz.) Gold futures saw ADV reach 47,980 contracts for the quarter, nearly three times greater than the first quarter of 2006. ADV in mini-sized (33 Oz.) Gold futures was 6,367 contracts in the first quarter, up 15 percent compared with the same period last year.
ADV in the CBOT Silver complex was 9,858 contracts in the first quarter – up three-fold compared with the same period in 2006. Full-sized (5,000 Oz.) Silver futures ADV was 7,974 contracts for the quarter, five times greater than the first quarter of 2006. Meanwhile, ADV in mini-sized (1,000 Oz.) Silver futures reached 1,876 contracts during the first quarter, an increase of 28 percent compared with the first quarter of 2006.
During the month of March, CBOT Metals complex ADV was 53,931 contracts – more than double the same month last year.
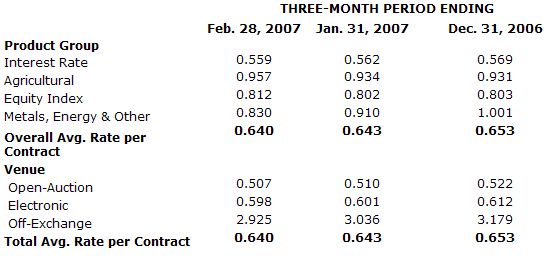
CBOT Rate Per Contract
The following chart depicts the Exchange’s February 2007 three-month rolling average rate per contract (in dollars), and the two preceding three-month periods’ average rates per contract. Average rate per contract represents total exchange and clearing revenue divided by total reported trading volume. Average rates per contract can be affected by exchange and clearing fee price levels, and the customer, product, venue and transaction mix.