CBOT President and CEO Bernard W. Dan said, "The CBOT has now achieved record volume for both quarters of 2007 - a testament to our focus on expanding global access to CBOT markets. With a strong, global population of market participants, we're confident that CBOT benchmark products will remain among the most liquid exchange-traded contracts in the global financial community."
Interest Rate Complex Achieves Record ADV; Up 57 Percent June Over June
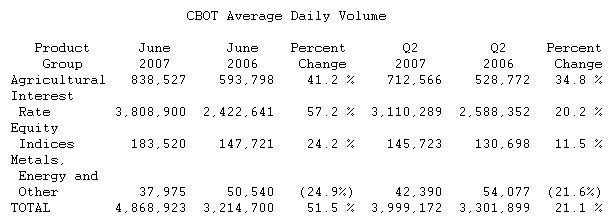
Quarterly ADV in the CBOT Interest Rate complex was a record 3,110,289 contracts - a 20 percent increase compared with the second quarter of 2006. June's ADV in the Interest Rate complex also achieved a record, 3,808,900 contracts, 57 percent greater than June 2006. Year-to-date, ADV in the CBOT Interest Rate complex is 3,071,710 contracts, up 19 percent compared to the same period in 2006.
In the second quarter, record ADV totals for 10-year U.S. Treasury Note futures (1,406,949 contracts) and 2-year U.S. Treasury Note futures (247,209 contracts) contributed to the quarterly ADV record for CBOT Financial futures. During the month of June, the Exchange also set monthly ADV records for 30-year U.S. Treasury Bond futures (539,921 contracts), 10-year U.S. Treasury Note futures (1,770,049 contracts), and 10-year U.S. Treasury Note options (373,379 contracts).
For the second quarter of 2007, ADV in the CBOT Interest Rate Swap complex was 4,802 contracts - two-and-a-half times greater than the same quarter a year earlier. During June 2007, an average of 8,868 contracts traded per day in the Interest Rate Swap complex, more than triple the ADV from June 2006. Both the 5-year and 10-year Interest Rate Swap contracts experienced significant growth in June. ADV for the 5-year and 10-year contracts more than tripled when comparing June 2007 ADV with ADV totals from June 2006.
Electronic trading volume of financial options contracts was 3,094,448 contracts in June 2007 - up 50 percent over June 2006. Year-to-date, an average of 96,082 financial options contracts are traded each day on the CBOT electronic trading platform, an increase of 38 percent compared with the same period in 2006. During the month of June, 27 percent of financial options ADV was traded electronically.
Agricultural Complex Sets Quarterly, Monthly ADV Records
The CBOT Agricultural complex achieved volume records for both the second quarter and the month of June. For the quarter, ADV was a record 712,566 contracts, a 35 percent increase over the second quarter of 2006. In June, ADV reached 838,527 contracts, 41 percent greater than the same month last year. Year-to-date, Agricultural complex ADV is 672,192 contracts, up 43 percent over the same period in 2006.
Increased electronic trading volume contributed to the record totals in the CBOT Ag Complex. For the second quarter, 60 percent of total CBOT Agricultural futures trading volume was conducted electronically.
The new volume records in the CBOT Ag complex were driven, in part, by record performance in the Wheat and Soybean complexes, which saw monthly ADV grow by 53 percent and 42 percent, respectively. The CBOT also set quarterly ADV records across its Corn futures and options complex (330,271 contracts), Wheat futures and options complex (104,664 contracts), Soybean futures and options complex (160,448 contracts), Soybean Meal futures and options complex (50,062 contracts), and Soybean Oil futures and options complex (60,400 contracts).
Record ADV in Equity Index Complex Features 24 Percent Growth in June 07
The CBOT Equity Index complex experienced ADV records for both the 2007 second quarter and the month of June. In June, the complex averaged 183,520 contracts traded per day, while second quarter ADV was 145,723 contracts - increases of 24 percent and 12 percent, respectively, over the same periods in the prior year. CBOT mini-sized Dow Jones futures contracts contributed to the overall complex ADV growth, as it also achieved monthly and quarterly ADV records. For the quarter, an average of 137,318 mini-Dow futures contracts traded each day, up 15 percent over the second quarter of 2006. During June, ADV for mini-Dow futures was 171,859 contracts, 30 percent greater than in June 2006.
The newest addition to the Equity Index complex, CBOT Dow Jones U.S. Real Estate (DJUSRE) Index(SM) futures contracts, continued to experience growth in liquidity during June 2007. Launched in late February of this year, the new DJUSRE Index futures contracts saw ADV grow by 28 percent in June 2007 compared with May 2007.
Silver Complex Continues ADV Growth Despite Decline in Metals Complex
ADV in the CBOT Metals complex was 41,964 contracts in the second quarter of 2007, a decline of 22 percent compared with the second quarter of 2006. Meanwhile, the Exchange's Full-sized (5,000 Oz.) Silver futures contracts continue to experience ADV growth. During the second quarter, ADV for Full-sized Silver futures was 5,923 contracts, up 30 percent over the second quarter of 2006. The growth in Silver futures has contributed to year-to-date ADV growth in the CBOT metals complex - 53,393 contracts, up 40 percent over the same period last year.
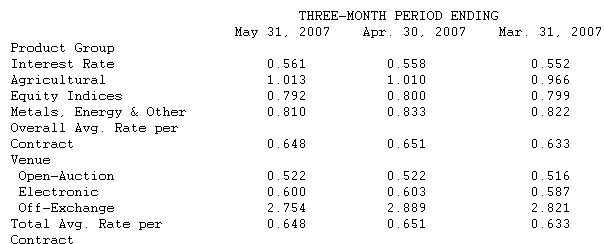
CBOT Rate Per Contract
The following chart depicts the Exchange's May 2007 three-month rolling average rate per contract (in dollars), and the two preceding three-month periods' average rates per contract. Average rate per contract represents total exchange and clearing revenue divided by total reported trading volume. Average rates per contract can be affected by exchange and clearing fee price levels, and the customer, product, venue and transaction mix.